Alphabet (GOOGL) — key metrics (June 4, 2026 close)
Price $372.19 | Market cap ~$4.54T | TTM and FY2025 data
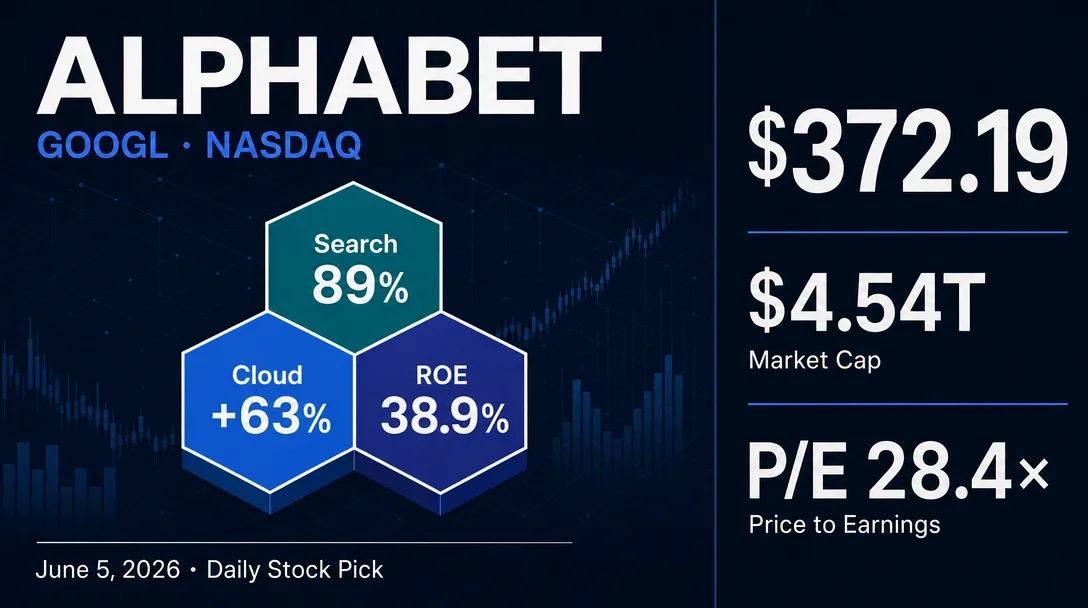
Alphabet Inc. (NASDAQ: GOOGL) passes all three hard screening criteria with ROE of 27.4% / 32.9% / 35.7% for FY2023–FY2025 (TTM 38.9%), positive FCF of $69.5B / $72.8B / $73.3B across the same three years, and a trailing P/E of 28.40×. The article covers all nine required information areas: business model (four revenue segments with Google Cloud as the fastest-growing major cloud at +63% YoY), ROE table with EDGAR methodology note, FCF bar chart, dual-axis revenue/earnings growth chart, full 8-peer valuation comparison table, balance sheet (D/E 0.20, interest coverage 111.85×, Moody's Aa2 / S&P AA+), six risk factors (DOJ search, DOJ ad tech, EU DMA, AI disruption, CapEx commitment, insider selling), near-term catalysts (Q2 earnings late July, analyst consensus $433 avg PT, Waymo expansion, June 8 ex-div), and competitive moat (search network effects, Android/Chrome lock-in, Cloud vertical stack, 13 products × 1B+ users). Closes with a structured bull/bear framework anchored on Q2 Cloud growth rate and DOJ search case timeline.

| Fiscal year | Net income | Common equity (end of year) | ROE |
|---|---|---|---|
| FY2023 (ended Dec 31, 2023) | $73.8B | $283.4B | 27.4% ✓ |
| FY2024 (ended Dec 31, 2024) | $100.1B | $325.1B | 32.9% ✓ |
| FY2025 (ended Dec 31, 2025) | $132.2B | $415.3B | 35.7% ✓ |
| TTM (through Mar 31, 2026) | $160.2B | — | 38.9% ✓ |
| Period | Operating CF | Capital expenditures | FCF | FCF margin |
|---|---|---|---|---|
| FY2023 | $101.8B | $32.3B | $69.5B | 22.6% |
| FY2024 | $125.3B | $52.5B | $72.8B | 20.8% |
| FY2025 | $164.7B | $91.5B | $73.3B | 18.2% |
| TTM | $174.4B | $109.9B | $64.4B | 15.3% |
| Period | Revenue | YoY growth | Net income | Net margin |
|---|---|---|---|---|
| FY2021 | $257.6B | — | n/a | — |
| FY2022 | $282.8B | +9.8% | n/a | — |
| FY2023 | $307.4B | +8.7% | $73.8B | 24.0% |
| FY2024 | $350.0B | +13.9% | $100.1B | 28.6% |
| FY2025 | $402.8B | +15.1% | $132.2B | 32.8% |
| TTM | $422.5B | +17.5% | $160.2B | 37.9% |
| Q1 2026 (quarter) | $109.9B | +21.8% | $62.6B | — |
| Company | Trailing P/E | Forward P/E | P/B | EV/EBITDA | PEG | ROE |
|---|---|---|---|---|---|---|
| GOOGL (Alphabet) | 28.40× | 29.79× | 9.42× | 27.95× | 1.85× | 38.9% |
| MSFT (Microsoft, enterprise cloud and productivity software) | 25.49× | 23.15× | 7.67× | 17.49× | 1.44× | 34.0% |
| META (Meta Platforms, social media and digital advertising) | 22.83× | 19.12× | 6.54× | 14.62× | 0.92× | 32.9% |
| AMZN (Amazon, e-commerce and AWS cloud) | 30.35× | 30.43× | 6.18× | 18.11× | 1.44× | 24.3%‡ |
| AAPL (Apple, consumer electronics and services ecosystem) | 37.73× | 34.14× | 42.87× | 28.19× | 3.04× | 141.5%* |
| ORCL (Oracle, enterprise database and AI cloud infrastructure) | 42.41× | 31.32× | 20.26× | 29.25× | 1.36× | 57.6%† |
| ADBE (Adobe, creative and digital experience software) | 15.07× | 10.73× | 9.18× | 10.95× | 0.83× | 58.8% |
| CRM (Salesforce, enterprise customer relationship management) | 21.91× | 13.56× | 4.52× | 14.37× | 0.84× | 16.9% |
| Peer median (7 peers excl. GOOGL) | 25.49× | 23.15× | 7.67× | 17.49× | 1.44× | 32.9% |
| Metric | Q1 2026 |
|---|---|
| Total assets | $703.9B |
| Cash + short-term investments | $126.8B |
| Total debt (incl. lease obligations) | $95.9B |
| Net cash | $31.0B |
| Debt / equity | 0.20 |
| Current ratio | 1.92 |
| Interest coverage | 111.85× |
Add more perspectives or context around this Post.